
Read a course’s insights
What the figures under Insights in Studio mean: enrollments, completion rate, usage per institution, block activity and quiz results.
Requires: Insights must be switched on for the workspace (on by default, Fracto sets the switch)
Under Insights you see how a course is used: completions, usage per institution, block activity and quiz results. The page shows figures only, no names of learners.
Before you start
- You have the Hub task “Create courses”. Without it the Insights entry is missing from the course sidebar.
- Insights must be switched on for the workspace. This is the default. Fracto sets the switch. If it is off, the entry is missing as well.
What the page counts
- The page loads the figures when you open it. There is no refresh button. Reload the page to see newer figures.
- All versions of the course and all institutions are counted. Withdrawn attempts and attempts whose membership ends stay in the figures, in the block activity map and in the quiz statistics. The Usage table does not count withdrawn attempts. So the sum of “Enrolled” can be smaller than the Enrollments.
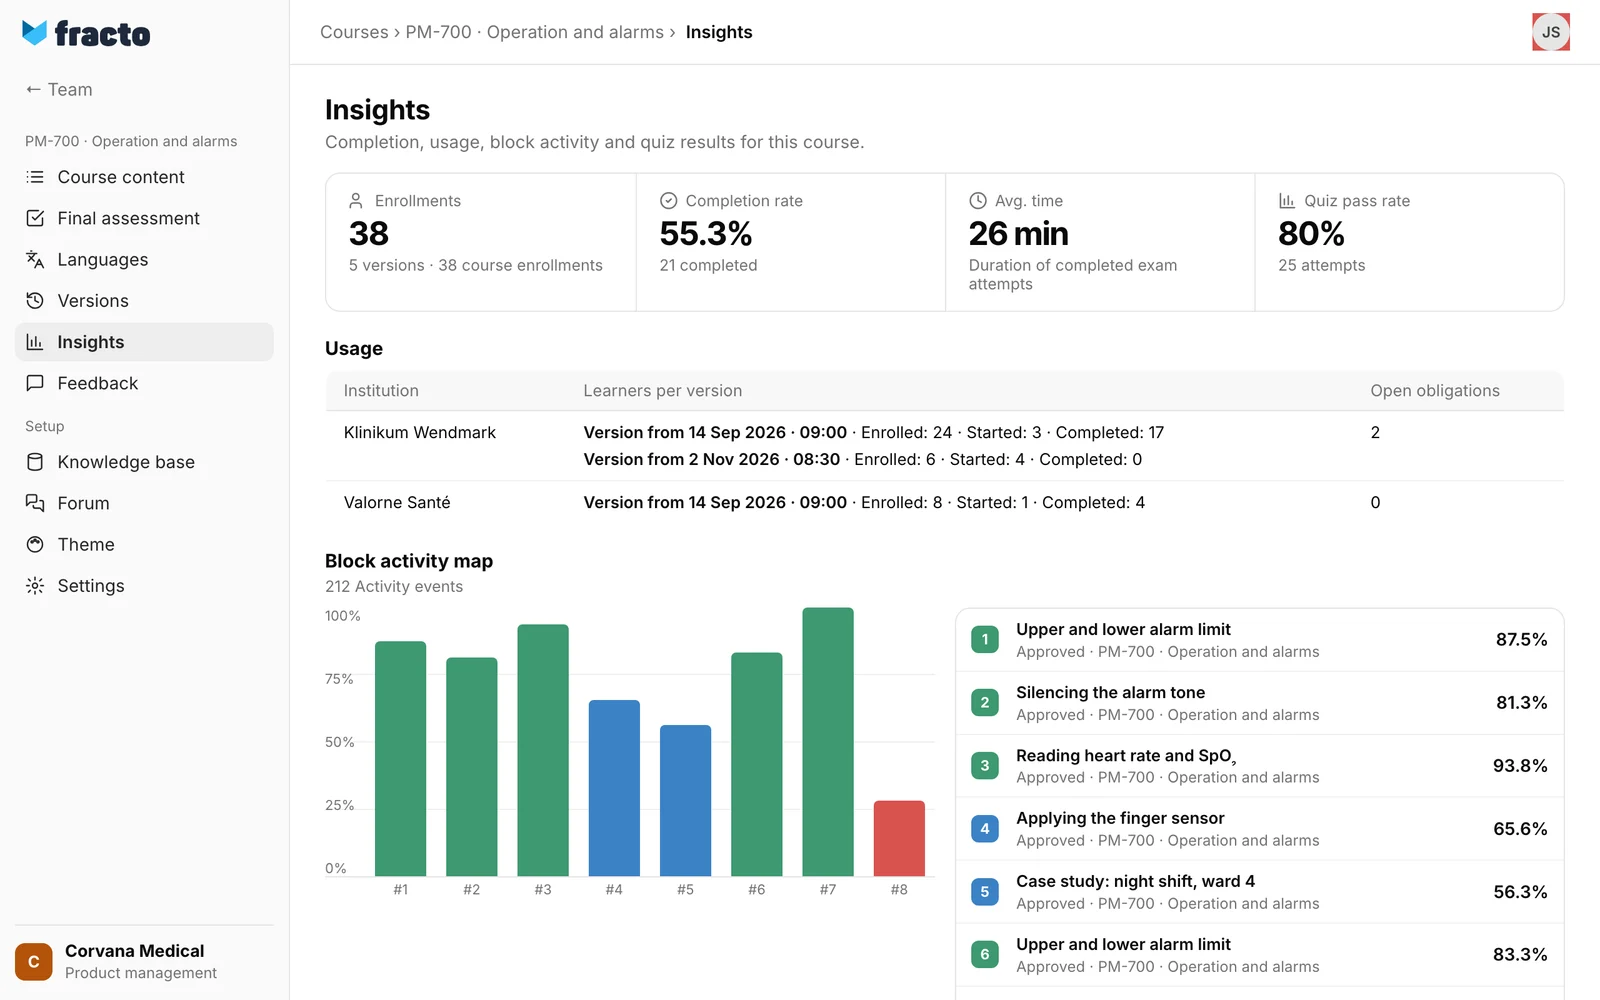
The four figures
| Figure | Meaning |
|---|---|
| Enrollments | Number of attempts at the course across all versions and institutions. Attempts are counted, not people. Someone who takes the course several times counts several times. Below it says ” |
| Completion rate | Share of completed attempts among the enrollments. Below it says how many are completed. |
| Avg. time | Mean duration of the completed exam attempts, from start to finish, passed or failed. This is the duration of the final assessment, not the learning time in the course. |
| Quiz pass rate | Share of passed attempts among the graded exam attempts of the final assessment. Below it is the number of these attempts. |
Percentages have at most one decimal place. If there is no basis yet, such as no graded attempt, it says “n/a”.
Usage
The Usage table has one row per institution that has the course in its library, has attempts at it, or has open obligations for it.
- Learners per version: For each version it says “Version from
· - Open obligations: Number of open obligations the institution has for this course.
If no institution has used the course yet, it says “No institution usage yet.”
Block activity map
The map shows how far learners get into the course. The heading gives the number of activity events, that is, recorded block views.
- The chart and the list show the eight blocks with the most views. Each row is one block in one published edition, and a correction has rows of its own here. The same block appears several times if it is in several editions. The name is the block’s heading or question, otherwise ”
- ”. Below it is the name of the version. - The percentage Interaction is the share of this version’s enrollments that reached the block. The colour shows the level: green from 80%, blue from 55%, yellow from 30%, red below that, grey without a value. Grey rows with “n/a” come from blocks in versions without attempts, for example versions you saved yourself or review versions. They fill the eight places when fewer blocks have views.
- Without data it says “No block data yet”.
Quiz statistics
Quiz statistics shows the results by question. All answers to questions in lessons are included, and the questions of the final assessment from graded exam attempts.
- For each question and version you see the share of correct answers and the number of Attempts. The chart shows the first eight questions (Q1 to Q8), the list shows all.
- Answers to a correction count with the version it corrects.
- Without data it says “No quiz data yet”.
Telling versions apart
The block activity map and the quiz statistics name versions by their name. If several versions have the automatic name “Approved ·
If it does not work
| Message | What it means |
|---|---|
| Insights could not be loaded. | The page could not load the figures, for example because of the connection. Reload. |
Insights could not be loaded (HTTP ). | The server refused the request. The number is the server’s code. Reload. |
Checked on 6 November 2026 against the current Fracto release.